LESSON PLAN
Name: Danielle Ortega
Title of lesson: Transformations of Quadratic Functions
Date of lesson: Unit:
Motion in Baseball, Wednesday of Week 3
Length of lesson: 45-50 minutes
Description of the class:
Name
of course: Algebra
II
Grade
level: 11th
Grade
Honors
or regular: Either
Source of the lesson:
Simulation from:
http://seeingmath.concord.org/resources_files/QuadraticGeneral.html
TEKS addressed:
A.9) Quadratic
and other nonlinear functions.
The student understands that the graphs of quadratic functions are affected by
the parameters of the function and can interpret and describe the effects of
changes in the parameters of quadratic functions.
(B) investigate, describe, and predict the effects of changes in
a on the graph of y = ax2 + c;
(C) investigate, describe, and predict the effects of changes in
c on the graph of y = ax2 + c;
2A.7) Quadratic
and square root functions.
The student interprets and describes the effects of changes in the parameters
of quadratic functions in applied and mathematical situations.
I.
Overview
Students will investigate
the graphs of different quadratic functions to determine the effects of
changing the parameters of the functions.
II. Performance or learner outcomes
Students
will be able to:
·
Predict the
effect of changing a and c in y = ax2 + c on
the graph of the function.
·
Predict the
effects of changing a, h, and k in y = a(x-h)2+k
on the graph of the function.
·
Compare the
shapes of two quadratic functions based solely on the parameters of their
equations.
III. Resources, materials and supplies needed
Computers
with Internet access
Soft
ball
Overheads
with graphs of parabolas
IV. Supplementary materials, handouts.
Handout: Transformations of Quadratic Functions
Five-E Organization
Teacher
Does Probing Questions Student
Does
|
Engage: Teacher leads brief
discussion about the parabolic path that a ball follows when it is across the
room. Teacher picks a volunteer
to stand at the other end of the classroom.
Teacher throws the ball to the volunteer twice, first in a low, wide
arch and then in a tall, skinny arch. “Today we will learn about
how to change the way a parabola looks by changing its equation.” |
(Holding a ball) If I were to throw this ball across the classroom, what shape would
its path be through the air? What was different about
the 2 paths the ball traced through the air each time it was thrown? What kind of function has
a parabola as its graph? Do you think the 2
parabolas just formed by the ball through the air could be represented by the
same equation? Does anyone know what a
transformation is? |
A curve or arch, some
might say a parabola One was longer and didn’t
go very high, the other went higher up but not as far across the room A quadratic function. No, they were different
paths so they must have different equations. Changing the way a graph
looks. Some might know words like reflection,
translation, rotation, etc. |
|
Explore: Students will go to
computers and follow the instructions on the handout “Transformations of
Quadratic Functions.” Teacher will
circulate and check for understanding by asking questions. |
Ask similar questions to those on the handout. Also ask students to explain their
predictions and ask other questions pertaining to the activity, such as… What do you think would
happen if we changed the first coefficient (a) to 5? What does it mean for the
first coefficient to be negative? How could we change the
equation of y = x2 to shift its graph down 12 units? |
Skinnier parabola. Parabola opens downward. Make the equation y = x2 -12. |
|
Explain: Students will
discuss their findings from the activity to make sure that everyone
understands that the a affects how wide or skinny
the parabola is and changing c shifts the parabola up or down. Teacher will show overheads each with 2
parabolas labeled A and B and ask students to decide between possible values
of a and c for each one. (Ex:
One overhead might have parabola A as y = -4x2 + 2 and parabola
B as y = 3x2 -3, without having their equations listed, of course). Students’ understanding
of the topics covered will be assessed by their ability to answer these
questions. |
(Referring to example given to the left) Which of these parabolas
could have -4 as its “a” value? Which
could have a negative value for c? |
A has a = -4. B has a
negative number for c. |
|
Extend / Elaborate: Teacher picks up the ball from the beginning
of class and throws it across the room again.
A volunteer comes to the board and draws a rough sketch of the path
the ball took through the air. Teacher
adds axes to the graph so that the vertex of the parabola lies on the
positive y-axis. Teacher throws the ball
again, but this time making sure to throw it so that it goes much higher and
not as far (a skinnier parabola). A
volunteer draws this parabola on the same axes with the first one. |
What can we say about the
equation of this parabola? What could a and c be? What
can we say about the a and c for this parabola’s
equation? How do they compare with
those of the first parabola? If
I continue to throw this ball, will it ever trace out a parabola for which the a is positive? |
a has to be negative, c
should be positive a still negative, but smaller (more negative) than
the first one. c
is greater than in the for the first parabola. No, the ball always has to
come back down so the parabola will always open downward |
|
Evaluate: Evaluation was performed periodically throughout
the lesson. |
|
|
Worksheet below (3 pages):
Transformations of a Quadratic Function
Go to http://seeingmath.concord.org/resources_files/QuadraticGeneral.html
In the bottom left corner of the screen, choose Polynomial form and make sure that the equation is set to y = 1x2 + 0 x + 0. Notice that you can manipulate these coefficients by selecting them and then clicking the up or down arrows.
Part I
1) Change the first coefficient (next to x2) to 2, leaving the other coefficients at 0 (we won’t be changing these at all yet). What happened to the graph of the function?
2) Click “new” to the right. On your new function, change the same coefficient to .2. What happened to the graph this time?
3) Click “new” again. On your new function, change the same coefficient to -6. What happened to the graph?
4) Click “new” one more time. Now choose your own coefficient. Write it here: ______ What do you predict your new graph will look like?
Put in your coefficient and check your prediction. Were you correct?
5) For a quadratic function y = ax2, what does the “a” determine or effect?
Part II
Click “Delete All” to the right and then click “New.” In the bottom left corner, make sure that “Polynomial Form” is still selected and that the coefficients are set to 1, 0, and 0 so that the equation reads y = 1x2 + 0x + 0. Click “New” again.
1) Now click on the 3rd coefficient and change it to 2, without changing the other 2 coefficients. (The equation should now read y = 1x2 + 0x + 2.) What happened to the graph of the function?
2) Click “New.” Now change the 3rd coefficient to -4. What happened to the graph?
3) Click “New.” Choose your own 3rd coefficient and write it here: ________. What do you predict your new graph will look like?
Put in your coefficient and check your prediction. Were you correct?
4) For a quadratic function y = ax2 + c, what does the “c” determine or effect?
5) Click “New” again. What do you predict will happen to the graph if we make the FIRST coefficient 2 and the THIRD coefficient -2?
Put in these coefficients and check
your prediction. (The equation should
now read y = 2x2
+ 0x + -2
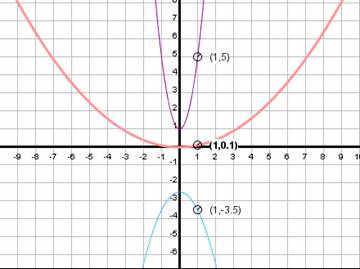
6) Three quadratic functions are graphed below. Their 3 equations are given below. Write the color of the corresponding graph next to its equation.
(a) y = -1.0x2 + -.25 color:______________________
(b) y = 4.0x2 + 1.0 color: ______________________
(c) y = 0.1x2 + 0 color: _____________________
Part III
Click “Delete All” and then click “New.” Now select “Vertex Form” and set the coefficients to 1, 0 and 0 across.
1) Change the second coefficient to 3. What happened to the parabola?
2) Click “New.” Change the second coefficient to -2. What happened to the parabola?
3) For a quadratic functions y = a(x-h)2 + k, what does the “h” determine or effect?
4) Click “Delete All” and then click “New.” Make sure you are still using vertex form. Make the second coefficient to 4 and the third coefficient to 1. What happened to the parabola? Where is its vertex?
5) Predict what the vertex of this parabola will be: y = (x + 6)2 - 4. ______________
Enter in the coefficients and check your prediction.
6) What is the vertex of the parabola given by y = a(x-h)2 + k? _______________