Mean,
Median, Mode, and Standard Deviation
Name(s):
Katie May
Title of
lesson: Mean, Median, Mode, and Standard
Deviation
Date of
lesson: Thursday and Friday of Week 1
Length
of lesson: 2 45-minute periods
Description
of the class:
Name
of course: Algebra II
Grade
level: 8-9h grade
Honors
or regular: Regular
Source
of the lesson:
Ron
Larson, Laurie Boswell, Timothy D. Kanold, and Lee Stiff’s Algebra 2
http://geography.about.com/od/populationgeography/a/lifeexpectancy.htm
www.census.gov/population/projections/MethTab2.xls
TEKS
addressed:
b(2A.1) Foundations for functions. The
student uses properties and attributes of functions and applies functions to
problem situations.
The student is expected to:
(A) identify the mathematical domains and ranges of functions and
determine reasonable domain and range values for continuous and discrete
situations; and
(B) collect and organize data, make and interpret scatterplots, fit
the graph of a function to the data, interpret the results, and proceed to
model, predict, and make decisions and critical judgments.
I. Overview
Students will learn about basic
statistical analysis and measures of central tendency. Specifically, students
will be able to find the mean, median, mode, and standard deviation of a given
set of data. If students have previously learned this material, more emphasis
can be placed on making predictions based on data and creating statistical
graphs.
II. Performance or learner
outcomes
Students
will be able to:
· Mean
of a data set
· Median
of a data set
· Mode
of a data set
· Standard
deviation of a data set
III. Resources,
materials and supplies needed
·
1 calculator per group
·
1 piece of graph paper per group
·
1 pencil per student
·
1 note card per student
·
1 textbook per student
IV. Supplementary
materials, handouts. (Also
address any safety issues
Concerning
equipment used)
·
1 print out of the first website listed above per
student (copied in Appendix A) or access to a computer
·
1 print out of the second website listed above per
student (the necessary portion copied in Appendix B) or access to a computer
V. Safety Issues
·
While there are no specific safety issues, safe
classroom procedures should be used with pencils, calculators, and other
materials.
Five-E Organization
Day 1
Teacher Does Probing
Questions
Student Does
|
Engage: Approx. Time_5__mins
|
What do you think the average age of death is for a person
in the United States? What about the world? Why do you think people in some countries live longer than
other countries? |
Student will give various answers such as 60, 70, and 80. Students will probably give similar answers to the first
questions but might say lower ages such as 50 and 55. Students might say that some countries are healthier,
cleaner, and have better medical options while others are not as healthy and
do not have as many resources. |
|
Explore: “Well, today and tomorrow we will be looking at average
life expectancy and be answering some of these questions. We are going to
start by reading an article about life expectancy. I would like you to read
the article and then pair up with a partner to discuss what you learned and
questions you still have about life expectancy.” Teacher passes out the
article in Appendix A for students to read. Approx. Time__15_mins |
|
Students read the article and talk with a partner about
what they learned from the article and what question they still have about
life expectancy. |
|
Explain: The teacher leads a discussion of what the students
learned in the article. Approx. Time_5___mins |
What are some things you learned? The article mentioned many average life expectancies for
different countries. What is an average? How do you come up with an average? |
Students will most likely state various points of the
article, such as the low life expectancies of some countries and very high life
expectancies of others. “The middle.” “The most.” “What you expect.” Student will
probably give various answers and have some misconceptions about average. “Adding numbers together and then dividing.” “Surveying
people.” “Using math.” |
|
Extend / Elaborate: The teacher gives an explanation about mean, median, and
mode based on page 445 of the textbook. The teacher should give a clear
explanation of the definition of each word as well as how to find the mean,
median, and mode. The teacher should help clear any misconceptions stated in
the “Explain” section. The teacher should point out that these are all a part
of statistics and are called measures of central tendency. They are used to
help summarize and compare sets of data. Approx. Time__15__mins |
Is the average the number that is in the middle of the
data set? Is the average the number that happens the most in the
data set? Do the words mean and average mean the same thing? |
No, that is the median. No, that is the mode. Yes. |
|
Evaluate: Teacher asks students to fill out a “Minute Paper.” On a
note card they should write one thing they learned and one question they
still have about life expectancy or mean, median, and more. The teacher also assigns the students to read page 445 of
their textbook for homework. Approx. Time_5___mins |
|
Students fill out a note card with one thing they learned
and one question they still have. |
Day 2
Teacher Does Probing
Questions
Student Does
|
Engage: Approx. Time_5__mins
|
Yesterday, we talked about mean, median, and mode. In
light of our unit, “Will you live to be 110?,” why do think it would be
helpful to know the mean, median, and mode of life expectancy? |
“To see how long people normally live.” “So we can tell if
most people live to be a certain age.” “To help us see how other factors
affect life expectancy.” |
|
Explore: The teacher explains that today the students will be
working with information from the census bureau about life expectancies by
state. Before splitting the class into groups of three, the teacher gives the
following instructions: Each group will be given the table in Appendix B. The
students will need to find the mean, median, and mode of the data, as well as
graph a histogram on a sheet of graph paper. One student will be the
“Calculator” of the mean, median, and mode. One student will be the
“Recorder” of the mean, median, and mode. One student will be the “Graph-er”
of the data. Even though each person has a specific role, all the group
members need to collaborate to find the answers and draw a histogram. Approx. Time_15__mins |
|
Students find the mean, median, and mode of the data.
Students draw a histogram on a piece of graph paper. |
|
Explain: The teacher asks each “Recorder” to come up to the board
and write the mean, median, and mode they found. They should also draw a
small histogram. Approx. Time__10__mins |
What was the mean of the states’ life expectancies? What was the median of the states’ life expectancies? What was the mode of the states’ life expectancies? Why was there no mode? |
76.9 77.3 There wasn’t one. Each life expectancy was different. |
|
Extend / Elaborate: The teacher explains that there is another measure of
central tendency called standard deviation. The teacher explains the formula
for standard deviation and asks students to start to calculate the standard
deviation for the data in their groups. The students can look at page 446 in
their textbook for help. Approx. Time__10__mins |
|
The students begin to work on finding the standard
deviation for the data in groups. |
|
Evaluate: The students are to continue calculating the standard
deviation at home for homework and bring back the standard deviation they
found the next day. Approx. Time__5__mins |
|
For homework, the students will finish finding the
standard deviation, which is 1.52 years. |
· Note: Some classes may finish the Day 1 activities early and can move on to the Day 2 exploration. This will allow more time for the students to begin calculating the standard deviation on Day 2.
Appendix A
Life Expectancy
http://geography.about.com/od/populationgeography/a/lifeexpectancy.htm
From Matt Rosenberg
Jan
3 2006
Life expectancy from birth is a
frequently utilized and analyzed component of demographic data for the
countries of the world. It represents the average life span of a newborn and is
an indicator of the overall health of a country. Life expectancy can fall due
to problems like famine, war, disease and poor health. Improvements in health
and welfare increase life expectancy. The higher the life expectancy, the
better shape a country is in.
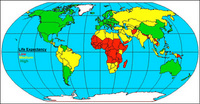
As you can see from the map, more developed regions of the
world generally have higher life expectancies (green) than less developed regions
with lower life expectancies (red). The regional variation is quite dramatic.
However, some countries like Saudi Arabia have very high GNP
per capita but don't have high life expectancies. Alternatively, there are
countries like China and Cuba that have low GNP per capita have reasonably high
life expectancies.
Life expectancy rose rapidly in the twentieth century due to
improvements in public health, nutrition and medicine.
It's likely that life expectancy of the most developed
countries will slowly advance and then reach a peak in the range of the mid-80s
in age. Currently, microstates Andorra, San Marino, and Singapore along with
Japan have the world's highest life expectancies (83.5, 82.1, 81.6 and 81.15,
respectively).
Unfortunately, AIDS has taken its toll in Africa, Asia and
even Latin America by reducing life expectancy in 34 different countries (26 of
them in Africa). Africa is home to the world's lowest life expectancies with
Swaziland (33.2 years), Botswana (33.9 years) and Lesotho (34.5 years) rounding
out the bottom.
Between 1998 and 2000, 44 different countries had a change of
two years or more of their life expectancies from birth and 23 countries
increased in life expectancy while 21 countries had a drop.
Sex Differences
Women almost always have higher life expectancies than men.
Currently, the worldwide life expectancy for all people is 64.3 years but for
males it's 62.7 years and for females life expectancy is 66 years, a difference
of more than three years. The sex difference ranges from four to six years in
North America and Europe to more than 13 years between men and women in Russia.
The reasons for the difference between male and female life
expectancy are not fully understood. While some scholars argue that women are
biologically superior to men and thus live longer, others argue that men are
employed in more hazardous occupations (factories, military service, etc).
Plus, men generally drive, smoke and drink more than women - men are even more
often murdered.
Historic Life Expectancy
During the Roman Empire, Romans had a approximate life
expectancy of 22 to 25 years. In 1900, the world life expectancy was
approximately 30 years and in 1985 it was about 62 years, just two years short
of today's life expectancy.
Aging
Life expectancy
changes as one gets older. By the time a child reaches their first year, their
chances of living longer increase. By the time of late adulthood, ones chances
of survival to a very old age are quite good. For example, although the life
expectancy from birth for all people in the United States is 77.7 years, those
who live to age 65 will have an average of almost 18 additional years left to
live, making their life expectancy almost 83 years.
Appendix B
|
Table
2: Average Life Expectancy at Birth by State for 2000 and Ratio of Estimates
and Projections of Deaths: 2001 to 2003 |
|
|
|
|
|
State |
Life expectancy at birth Total |
|
Alabama |
74.6 |
|
Alaska |
76.7 |
|
Arizona |
77.5 |
|
Arkansas |
75.1 |
|
California |
78.3 |
|
Colorado |
78.4 |
|
Connecticut |
78.4 |
|
Delaware |
76.6 |
|
District of
Columbia |
72.6 |
|
Florida |
77.5 |
|
Georgia |
75.3 |
|
Hawaii |
79.8 |
|
Idaho |
78.0 |
|
Illinois |
76.7 |
|
Indiana |
76.2 |
|
Iowa |
78.5 |
|
Kansas |
77.5 |
|
Kentucky |
75.3 |
|
Louisiana |
74.4 |
|
Maine |
77.6 |
|
Maryland |
76.3 |
|
Massachusetts |
78.4 |
|
Michigan |
76.5 |
|
Minnesota |
79.1 |
|
Mississippi |
73.7 |
|
Missouri |
76.2 |
|
Montana |
77.3 |
|
Nebraska |
78.3 |
|
Nevada |
75.9 |
|
New
Hampshire |
78.5 |
|
New
Jersey |
77.5 |
|
New
Mexico |
77.3 |
|
New York |
77.9 |
|
North
Carolina |
75.8 |
|
North
Dakota |
78.7 |
|
Ohio |
76.4 |
|
Oklahoma |
75.3 |
|
Oregon |
77.9 |
|
Pennsylvania |
76.8 |
|
Rhode
Island |
78.2 |
|
South
Carolina |
74.9 |
|
South
Dakota |
78.0 |
|
Tennessee |
75.0 |
|
Texas |
76.7 |
|
Utah |
78.7 |
|
Vermont |
78.2 |
|
Virginia |
76.9 |
|
Washington |
78.2 |
|
West
Virginia |
75.0 |
|
Wisconsin |
78.1 |
|
Wyoming |
77.1 |
|
Footnote: |
|
|
U.S.
Census Bureau, Population Division, Interim State Population Projections,
2005. |
|
|
Internet
Release Date: April 21, 2005 |
|